
ESG Deep Dive: How to Pick your Big Oil Stocks?
Can Oil and Gas companies have a comfortable spot in ESG portfolios? This was a hotly debated question during 2020 and 2021 when international oil companies successively announced net-zero targets and ambitious low carbon projects.
In a webinar hosted on January 25th, AlphaValue addressed this tricky subject of 'Investing in European Integrated Oil Companies (IOCs) during the energy transition era and strategies for stock selection.'
The discussion delved into whether oil companies can contribute to energy transition and support the objectives outlined in the 2015 Paris Accord. The session also explored the progress made by European IOCs in aligning their businesses with energy transition goals.
The key conclusions from the webinar should be laid out at the beginning:
Key indicators for performance benchmarking
Our analyst elaborated on some key indicators to compare IOCs and their ESG scorecard. We looked at 4 indicators but because this is just a glimpse available to all, we are narrowing it down to 2 indicators that we feel are the most pertinent.
Let’s look at carbon intensity per capital employed. We can see that bp and ENI have the best performance in 2022.
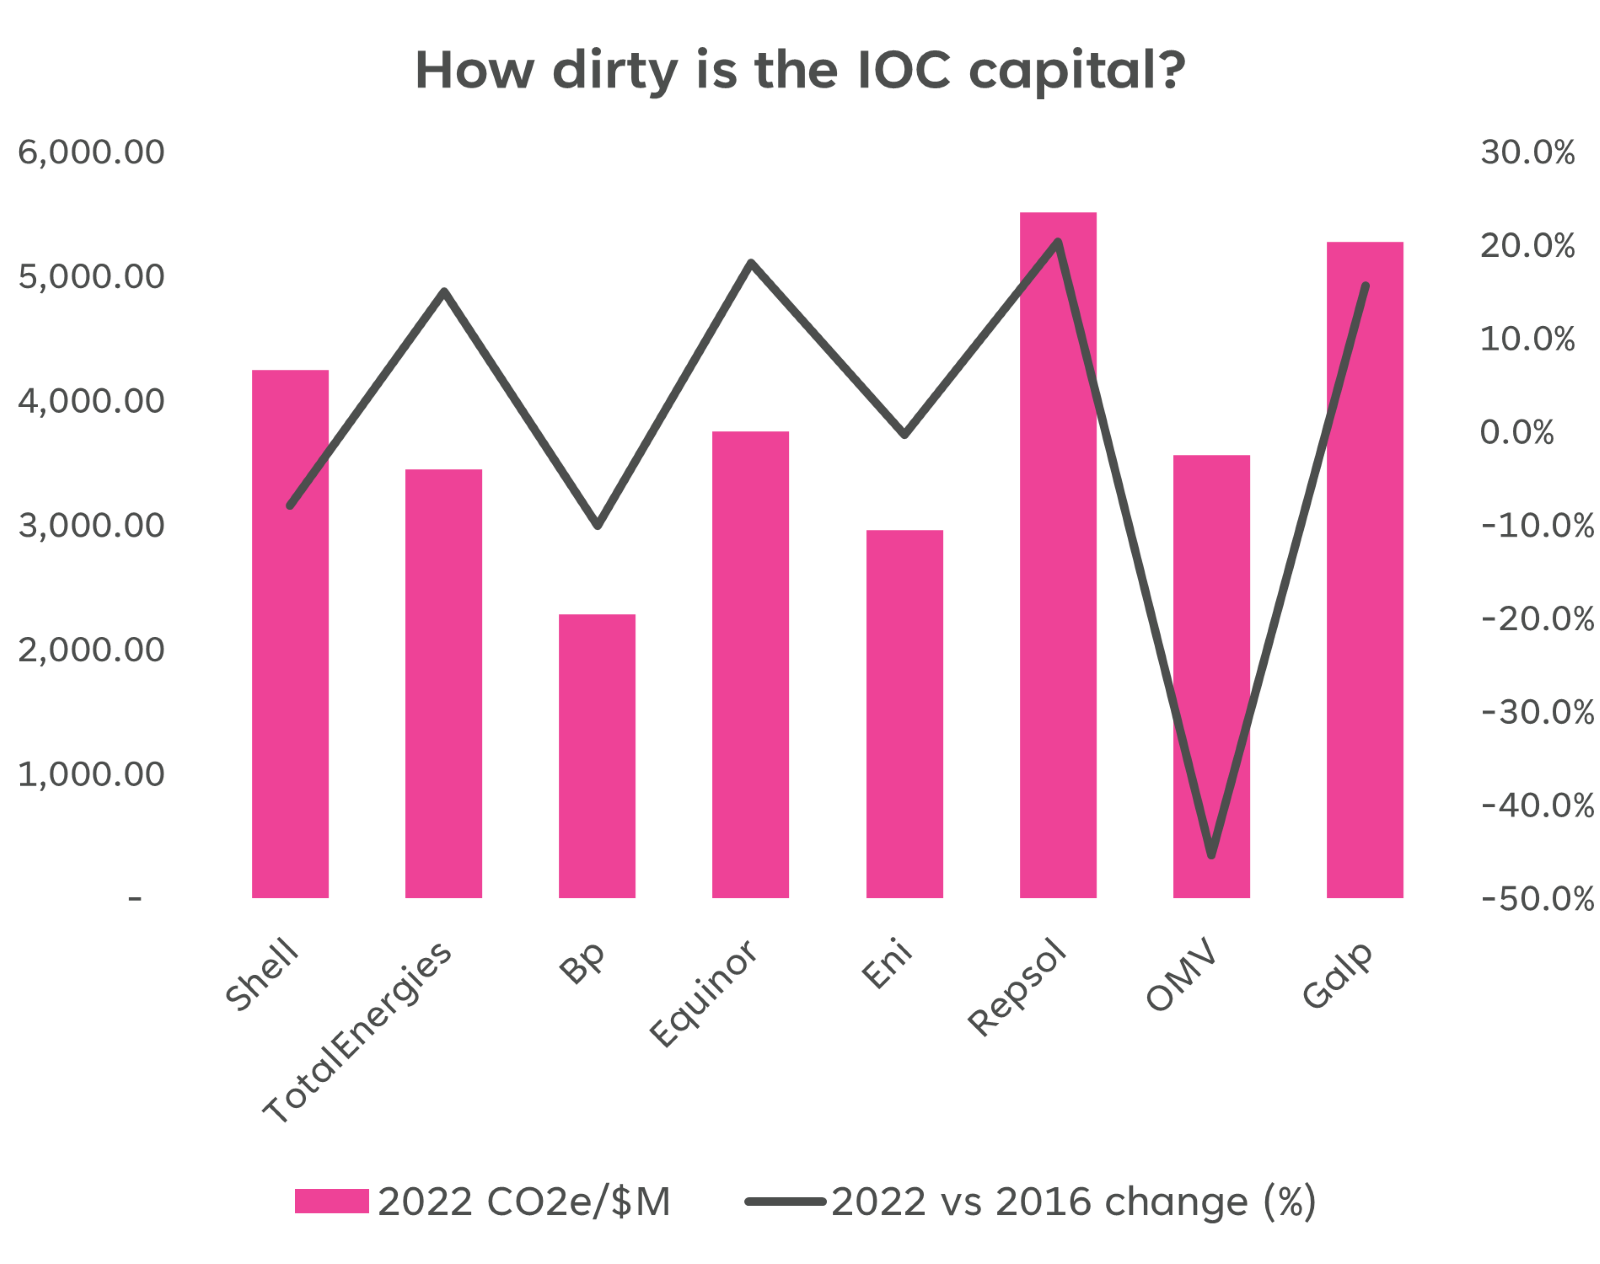
Source: AlphaValue
Comparing carbon intensity per unit of capital employed to the year 2016, we observe that Shell, bp, eni, and OMV are at the forefront, with OMV achieving a remarkable 45% reduction.
Shifting our focus to total emissions, which includes Scope 1, 2, and 3 emissions, we find that Shell, bp, and TotalEnergies rank among the largest emitters, a correlation attributed to their production volumes. Notably, Shell, bp, and OMV have exhibited significant efforts in reducing emissions since 2016. However, Shell’s divestment of oil shale was key to this achievement. Then the question arises: Is divestment a good and viable strategy?
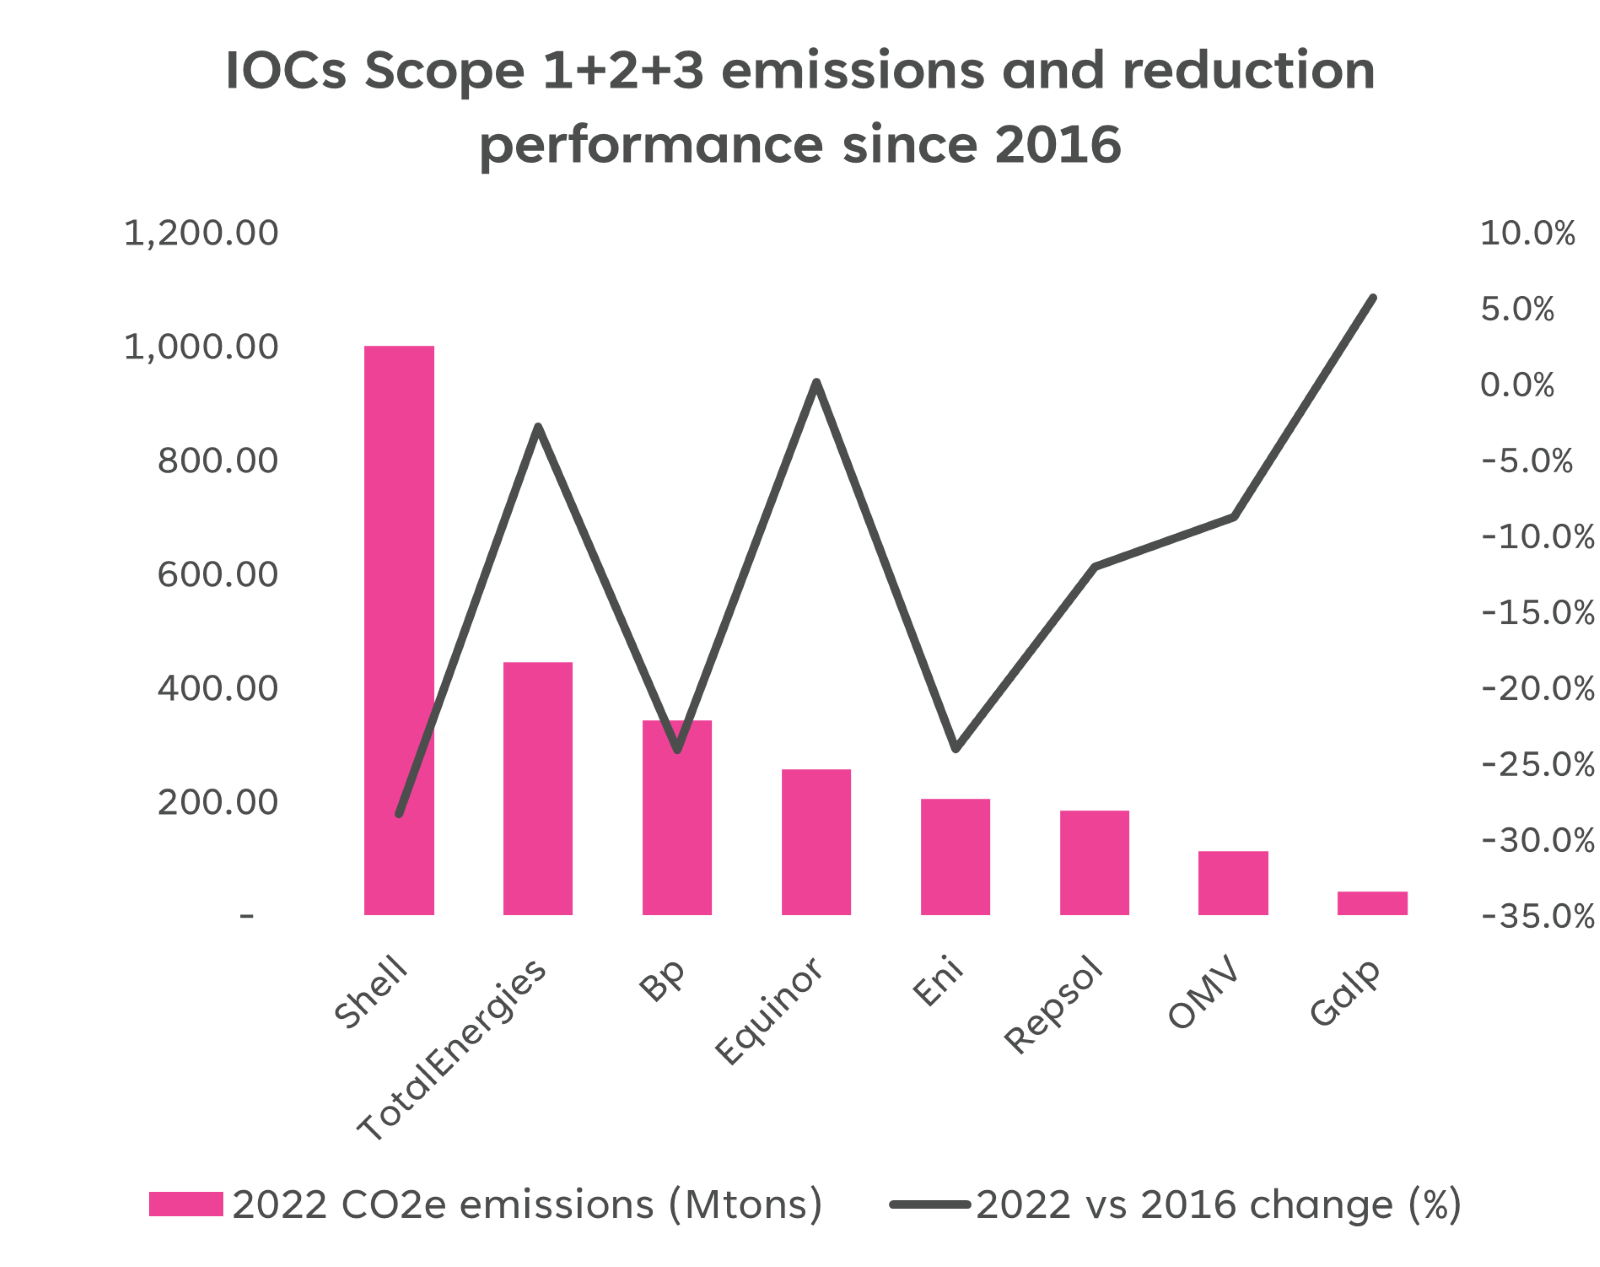 Source: AlphaValue
Overview of European Integrated Oil companies
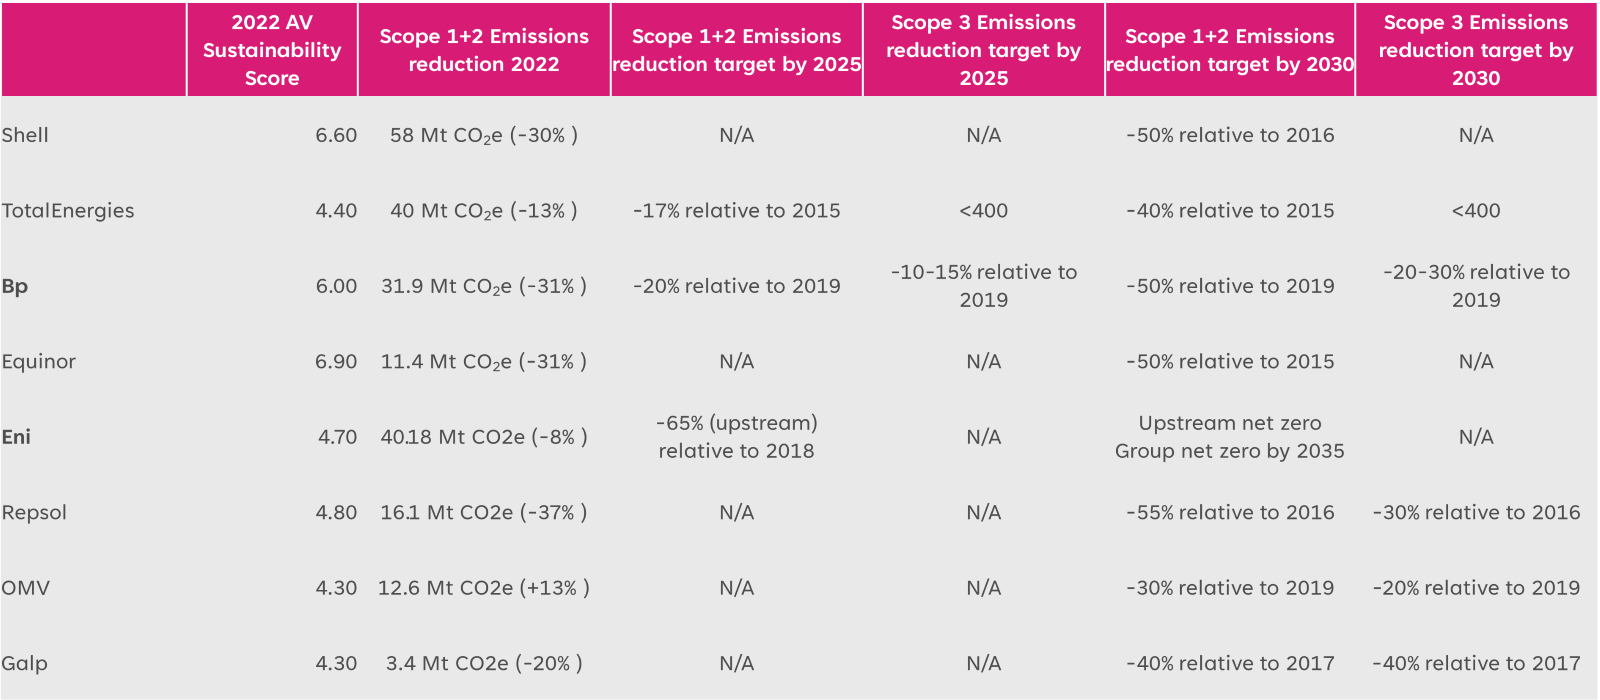
The above table showcases both the historical efforts and future initiatives undertaken by these companies to reduce emissions. In Scope 1+2, most companies have set more or less a similar target although their absolute emissions vary significantly. ENI stands out with the target to achieve net zero in Scope 1 +2 emissions by 2035 at the group level. This is quite ambitious compared to peers because the company will be producing around 1.8-1.9 mboepd by 2030, a 4% annual increase till 2026 and then plateau production till 2030.
Scope 3 target commitments have been a controversial topic in the industry as very few companies have announced targets. The Big Oil members of the European integrated family – except for bp – has refrained from absolute emission targets.
Top Picks in the context of Energy Transition
TotalEnergies
Total exhibits significant upside potential driven by strong cash flow generation. In the realm of energy transition, TotalEnergies boasts the highest net installed renewable capacity among its peers, with one-third of its investments dedicated to renewable energy. Notably, TotalEnergies maintains no exposure to shale oil or oil sands and is actively investing in low-emission offshore projects, currently recognized as some of the cleanest ventures in the oil and gas exploration sector.
However, in terms of emissions management, the company's progress and targets, especially in the context of Scope 3 emissions, are trailing behind its industry peers. The Uganda projects present a significant challenge, posing a notable downside for the company's ESG scorecard.
ENI
ENI focuses predominantly on upstream activities related to gas and LNG. With a production plateau at 1.9 million barrels of oil equivalent per day (mboe/d), their strategic vision aims for over 90% of production to be comprised of gas post-2040, recognizing the environmental advantages of gas over oil.
In the downstream sector, ENI is actively engaged on multiple fronts. Their ambitious plans include the development of 15 gigawatts (GW) of renewable capacity by 2030. Additionally, they have a robust and expanding biofuels business facilitated by a feedstock integration model.
Compared to its industry peers, ENI maintains a comparatively cleaner capital structure. However, it's noteworthy that ENI exhibits a relatively high upstream per-barrel intensity in comparison to its peers. There is potential for the company to further accelerate its emission reduction efforts in alignment with its business model.
An additional challenge is associated with its CEO, who has been implicated in various corruption cases in African countries, presenting a downside for the company's reputation and corporate governance.
Technip Energies
Technip Energies is a preferred choice of our analyst due to its prominent position in large-scale LNG facilities, providing a leading advantage. Anticipating increased business, the company is expected to secure more deals in the forthcoming years. Notably, Technip Energies has introduced four proprietary technologies, namely SnapLNG, BlueH, eFurnace, and Canopy, covering a comprehensive range of relevant renewable and low-carbon energy solutions. The company is also keen on expanding its technologies across the downstream value chain.
With a robust net cash position, Technip Energies remains financially stable. Despite recent coverage in Le Monde, the company has effectively managed its exit from Russian engagements. Given these factors, we view it as an opportune entry point.
This is just a short summary of some of the topics discussed. The whole presentation with its recording is available on AlphaValue.eu.
In a webinar hosted on January 25th, AlphaValue addressed this tricky subject of 'Investing in European Integrated Oil Companies (IOCs) during the energy transition era and strategies for stock selection.'
The discussion delved into whether oil companies can contribute to energy transition and support the objectives outlined in the 2015 Paris Accord. The session also explored the progress made by European IOCs in aligning their businesses with energy transition goals.
The key conclusions from the webinar should be laid out at the beginning:
- Oil and gas is an extraction business which is ipso facto never perfectly ESG aligned. By 2050, when the world still consumes oil and gas, the extraction and transportation process will continue to emit GHGs and even spill oil – which will be offset by various decarbonization measures.
- When evaluating IOCs’ environmental performance, emission targets should not be the sole criteria to include them in the ESG portfolio. Alphavalue emphasizes i) a business model that secures profitability from low carbon projects ii) a consistent strategy execution that does not destroy the shareholder value.
- Hydrocarbon portfolio consisting of long-cycle assets producing low CO2 intensive molecules. Companies with no exposure to oil sands and shale oil are deeply disadvantaged while those with an offshore-weighted portfolio (deepwater including) can make the difference to achieve absolute upstream GHG reduction.
Key indicators for performance benchmarking
Our analyst elaborated on some key indicators to compare IOCs and their ESG scorecard. We looked at 4 indicators but because this is just a glimpse available to all, we are narrowing it down to 2 indicators that we feel are the most pertinent.
Let’s look at carbon intensity per capital employed. We can see that bp and ENI have the best performance in 2022.
Source: AlphaValue
Comparing carbon intensity per unit of capital employed to the year 2016, we observe that Shell, bp, eni, and OMV are at the forefront, with OMV achieving a remarkable 45% reduction.
Shifting our focus to total emissions, which includes Scope 1, 2, and 3 emissions, we find that Shell, bp, and TotalEnergies rank among the largest emitters, a correlation attributed to their production volumes. Notably, Shell, bp, and OMV have exhibited significant efforts in reducing emissions since 2016. However, Shell’s divestment of oil shale was key to this achievement. Then the question arises: Is divestment a good and viable strategy?
Overview of European Integrated Oil companies
The above table showcases both the historical efforts and future initiatives undertaken by these companies to reduce emissions. In Scope 1+2, most companies have set more or less a similar target although their absolute emissions vary significantly. ENI stands out with the target to achieve net zero in Scope 1 +2 emissions by 2035 at the group level. This is quite ambitious compared to peers because the company will be producing around 1.8-1.9 mboepd by 2030, a 4% annual increase till 2026 and then plateau production till 2030.
Scope 3 target commitments have been a controversial topic in the industry as very few companies have announced targets. The Big Oil members of the European integrated family – except for bp – has refrained from absolute emission targets.
Top Picks in the context of Energy Transition
TotalEnergies
| Target Price |
Fundamental Strength |
Momentum |
Sustainability Score |
| €81.2 |
5/10 |
+ |
5/10 |
Total exhibits significant upside potential driven by strong cash flow generation. In the realm of energy transition, TotalEnergies boasts the highest net installed renewable capacity among its peers, with one-third of its investments dedicated to renewable energy. Notably, TotalEnergies maintains no exposure to shale oil or oil sands and is actively investing in low-emission offshore projects, currently recognized as some of the cleanest ventures in the oil and gas exploration sector.
However, in terms of emissions management, the company's progress and targets, especially in the context of Scope 3 emissions, are trailing behind its industry peers. The Uganda projects present a significant challenge, posing a notable downside for the company's ESG scorecard.
ENI
| Target Price |
Fundamental Strength |
Momentum |
Sustainability Score |
| €17.1 |
5/10 |
- |
4/10 |
| (in MtCO2eq) |
FY 2021 |
FY 2022 |
Target |
| Scope 1 |
40.08 |
39.39 |
Reduce Scope 1, 2, 3 emissions from equity output by 35% by 2030 and 80% by 2040 vs 2018 and net zero by 2050 on equity basis |
| Scope 2 |
0.81 |
0.79 | |
| Scope 3 Upstream |
176 |
164 |
ENI focuses predominantly on upstream activities related to gas and LNG. With a production plateau at 1.9 million barrels of oil equivalent per day (mboe/d), their strategic vision aims for over 90% of production to be comprised of gas post-2040, recognizing the environmental advantages of gas over oil.
In the downstream sector, ENI is actively engaged on multiple fronts. Their ambitious plans include the development of 15 gigawatts (GW) of renewable capacity by 2030. Additionally, they have a robust and expanding biofuels business facilitated by a feedstock integration model.
Compared to its industry peers, ENI maintains a comparatively cleaner capital structure. However, it's noteworthy that ENI exhibits a relatively high upstream per-barrel intensity in comparison to its peers. There is potential for the company to further accelerate its emission reduction efforts in alignment with its business model.
An additional challenge is associated with its CEO, who has been implicated in various corruption cases in African countries, presenting a downside for the company's reputation and corporate governance.
Technip Energies
| Target Price |
Fundamental Strength |
Momentum |
Sustainability Score |
| €19.71 |
6/10 |
-- |
5/10 |
| (in tonnes of CO2eq) |
FY 2021 |
FY 2022 |
Target |
| Scope 1 |
2,824 |
2,468 |
-30% in combined Scope 1&2 (baseline 2019) Net zero by 2030 |
| Scope 2 |
16,014 |
15 ,11 | |
| Scope 3 Upstream |
1,478,309 |
1,842,969 |
Net zero by 2050 |
| Scope 3 Downstream |
TBR* |
TBR* | |
| Scope 4 (Emissions avoided for clients) |
-1 798 038 |
-7 325 458 |
15 MtCO2eq by 2025 |
Technip Energies is a preferred choice of our analyst due to its prominent position in large-scale LNG facilities, providing a leading advantage. Anticipating increased business, the company is expected to secure more deals in the forthcoming years. Notably, Technip Energies has introduced four proprietary technologies, namely SnapLNG, BlueH, eFurnace, and Canopy, covering a comprehensive range of relevant renewable and low-carbon energy solutions. The company is also keen on expanding its technologies across the downstream value chain.
With a robust net cash position, Technip Energies remains financially stable. Despite recent coverage in Le Monde, the company has effectively managed its exit from Russian engagements. Given these factors, we view it as an opportune entry point.
This is just a short summary of some of the topics discussed. The whole presentation with its recording is available on AlphaValue.eu.
Subscribe to our blog


As tensions in Hormuz and the Russia-Ukraine energy standoff raise the risk of a major military acci...

AlphaValue's Fundamental Strength Indicator reveals 24 "unsinkable" business mo...