
P/Book message of caution
Book ratios are the slow investor’s best friend merely because the net asset value of most firms is not a volatile data. It should be Private Equity's friend too but this industry seems to prefer EV/Ebitda and Debt/Ebitda ratios which happen to be more easily manipulated to make flamboyant promises.
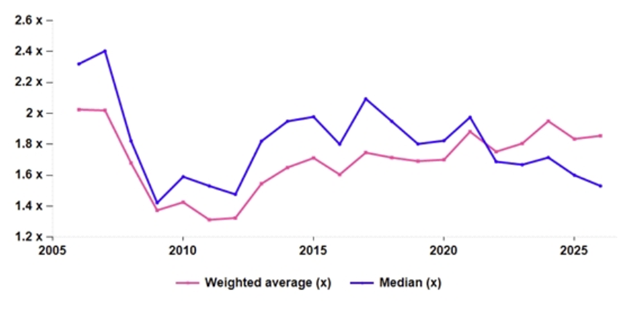
The long-term trend in the European equities P/Book ratio is that it goes up on a weighted basis while it declines on a median basis. This reflects the fact that much of the demand for European equities is focused on very large market caps while nobody will take mid cap risks. The market is trading at 1.95x its 2024 book value (weighted) against the 1.3x that followed the GFC debacle. The following long term chart shows that that any trend analysis (searching for what is the ‘correct’ P/Book) is a hard call as a good reference year is itself a hard call. We usually take 2017 as a healthy reference. The going price then was 1.74x. Markets are thus edging towards expensive (on a weighted basis).
Median market P/Book (blue) vs. weighted market P/Book (pink): 2006-2025
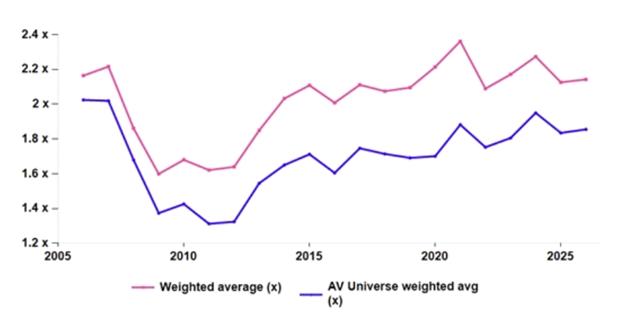
Digging deeper starts with the exclusion of Financials. The ex-Financials P/Book zooms above 2x and above all seems to camp above historic highs, i.e. pre GFC levels.
P/Book ex Financials (pink) vs. market P/Book (blue): 2006-2025
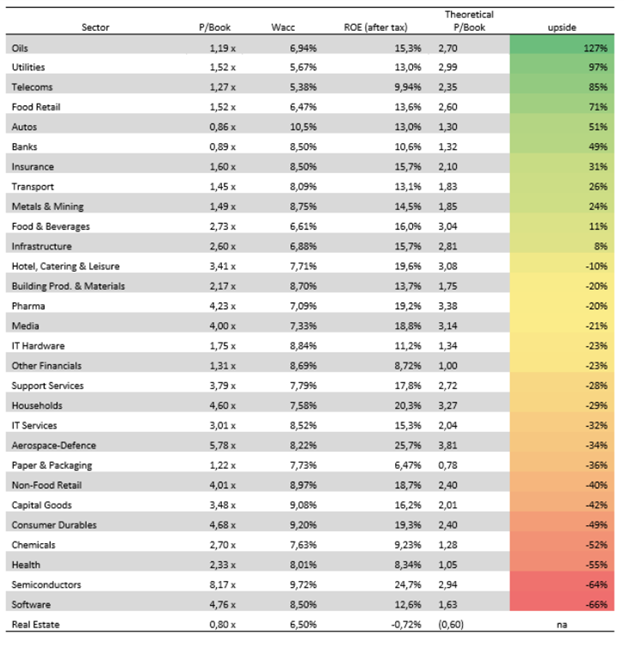
As we miss a COE by sector (too much hassle), we used the Wacc as a proxy. The pecking order of the sectors’ relative dearness is as follows. Unsurprisingly the table proposes that we stick with value sectors and dump growth ones.
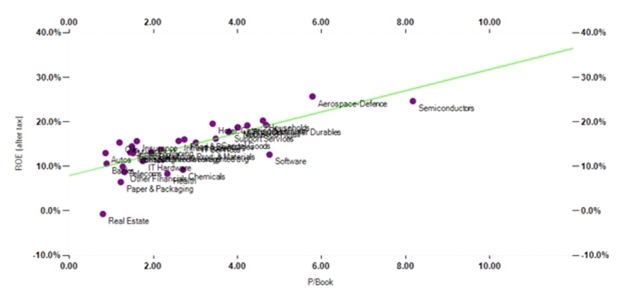
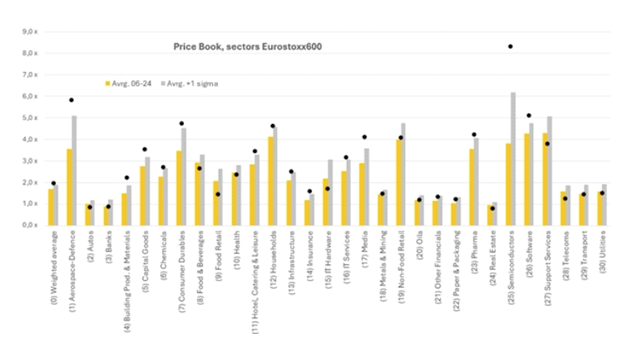
Presumably more useful is the last table provided by Sarim – AlphaSwing, a JV with AlphaValue relying on AlphaValue data. The chart pinpoints the current valuations that diverge substantially from both the average and the average + 1 standard deviation. On that historical perspective Aerospace and SemiConductors are seriously expensive … presumably as their circumstances have changed somewhat.
Then there is a long and unsurprising list of dear sectors (Building Materials, Capital Goods, Chemicals, Consumer Durables, Leisure, Households, IT services, Media, Pharma, Software) that does not differ so much from the pecking order derived from a normalised valuation.
P/Book, now matched to yesterday
The long-term trend in the European equities P/Book ratio is that it goes up on a weighted basis while it declines on a median basis. This reflects the fact that much of the demand for European equities is focused on very large market caps while nobody will take mid cap risks. The market is trading at 1.95x its 2024 book value (weighted) against the 1.3x that followed the GFC debacle. The following long term chart shows that that any trend analysis (searching for what is the ‘correct’ P/Book) is a hard call as a good reference year is itself a hard call. We usually take 2017 as a healthy reference. The going price then was 1.74x. Markets are thus edging towards expensive (on a weighted basis).
Median market P/Book (blue) vs. weighted market P/Book (pink): 2006-2025
Digging deeper starts with the exclusion of Financials. The ex-Financials P/Book zooms above 2x and above all seems to camp above historic highs, i.e. pre GFC levels.
P/Book ex Financials (pink) vs. market P/Book (blue): 2006-2025
Based on the time-honoured formula which wants P/Book to beequal to (roe-g)/(coe-g) with Roe at 13.2% (weighted), Coe at 8.5% and theproverbial g at 2%, the 2024 P/Book should be 1.72x. Ergo the market isconfirmed as becoming expensive.
What about sector P/Bs
As we miss a COE by sector (too much hassle), we used the Wacc as a proxy. The pecking order of the sectors’ relative dearness is as follows. Unsurprisingly the table proposes that we stick with value sectors and dump growth ones.
Presumably more useful is the last table provided by Sarim – AlphaSwing, a JV with AlphaValue relying on AlphaValue data. The chart pinpoints the current valuations that diverge substantially from both the average and the average + 1 standard deviation. On that historical perspective Aerospace and SemiConductors are seriously expensive … presumably as their circumstances have changed somewhat.
Then there is a long and unsurprising list of dear sectors (Building Materials, Capital Goods, Chemicals, Consumer Durables, Leisure, Households, IT services, Media, Pharma, Software) that does not differ so much from the pecking order derived from a normalised valuation.
P/Book, now matched to yesterday
Subscribe to our blog

Alphavalue Morning Market Tip
FY results in line - Dividend cut and new restructuring plan.

AI valuations are defying reality. As three mega-IPOs worth $3.5 trillion approach, markets are ignori...

AI capex is a bubble - tokens sold below cost, no returns in sight, and $1tn invested in 2026 alone wi...